Data Rich Reports
Session 8–Parameterized Reporting
What is Parameterized Reporting?
- Make one template report in Quarto
- Create R script file that allows you to make multiple reports from this template
Why Parameterized Reporting?
- Allows you to make multiple reports at once
- Avoids copy paste issues if you were to make multiple reports by hand
- It feels like magic!
Parameterized Reports We Have Made
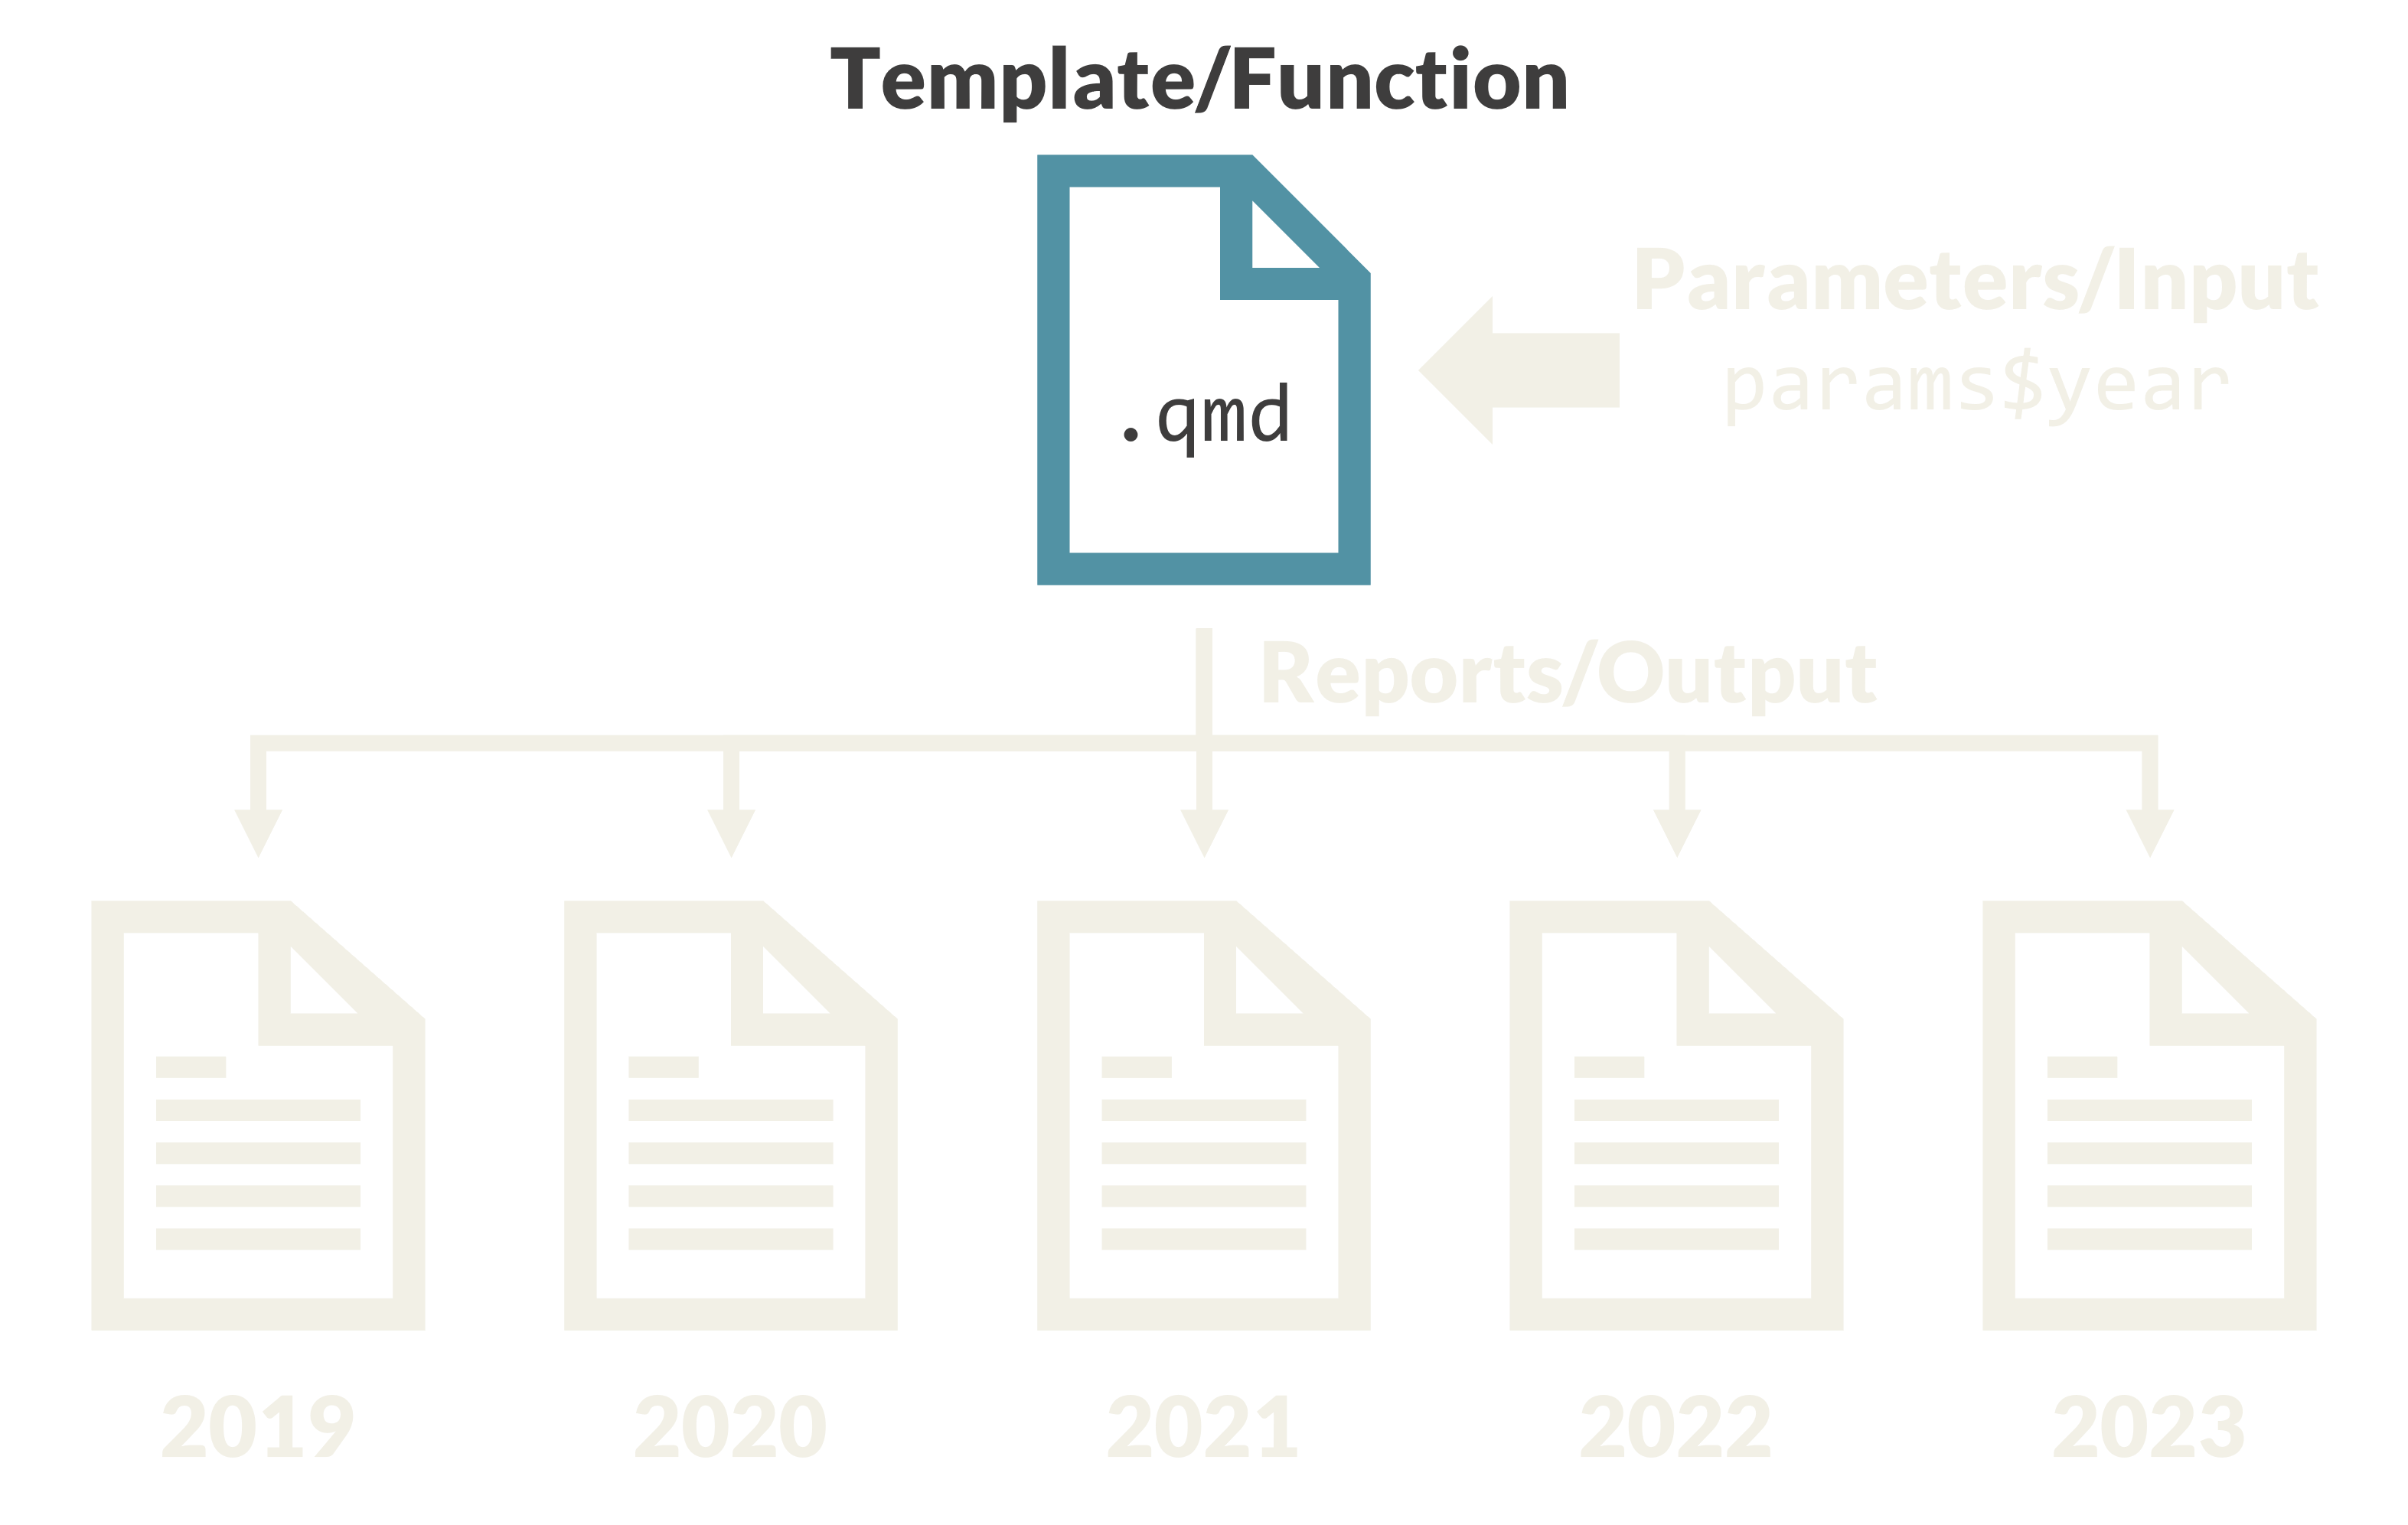
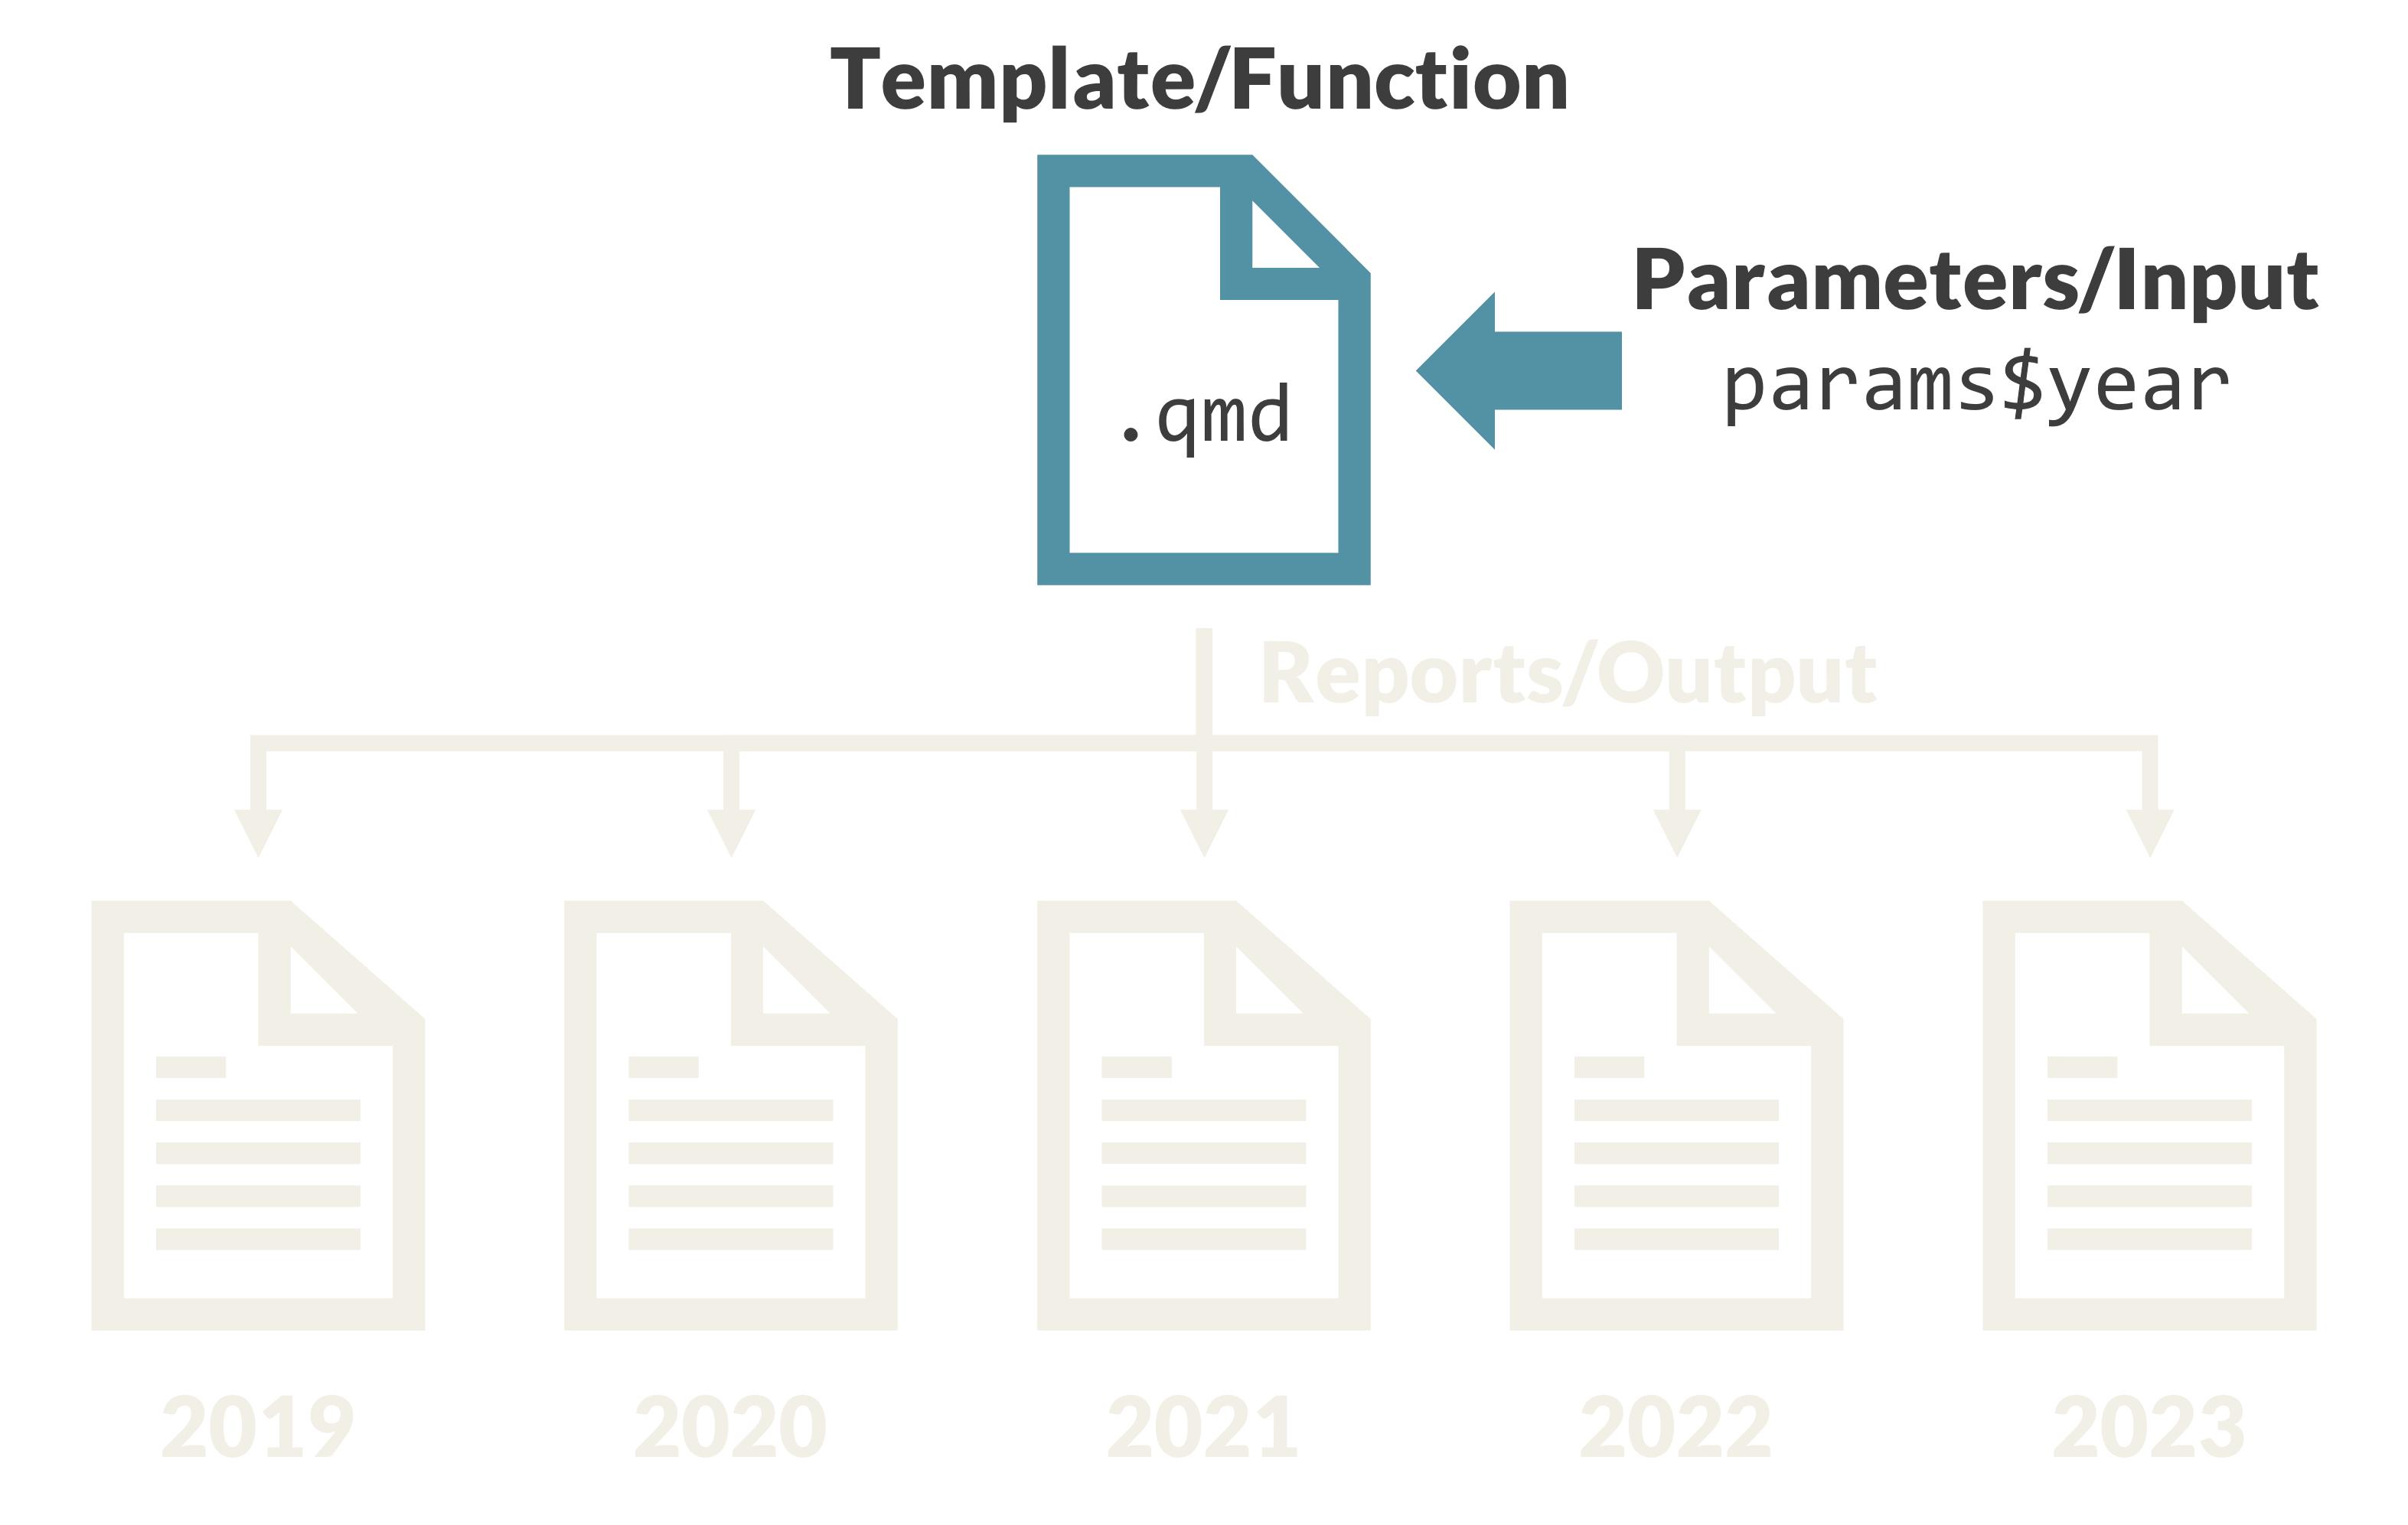
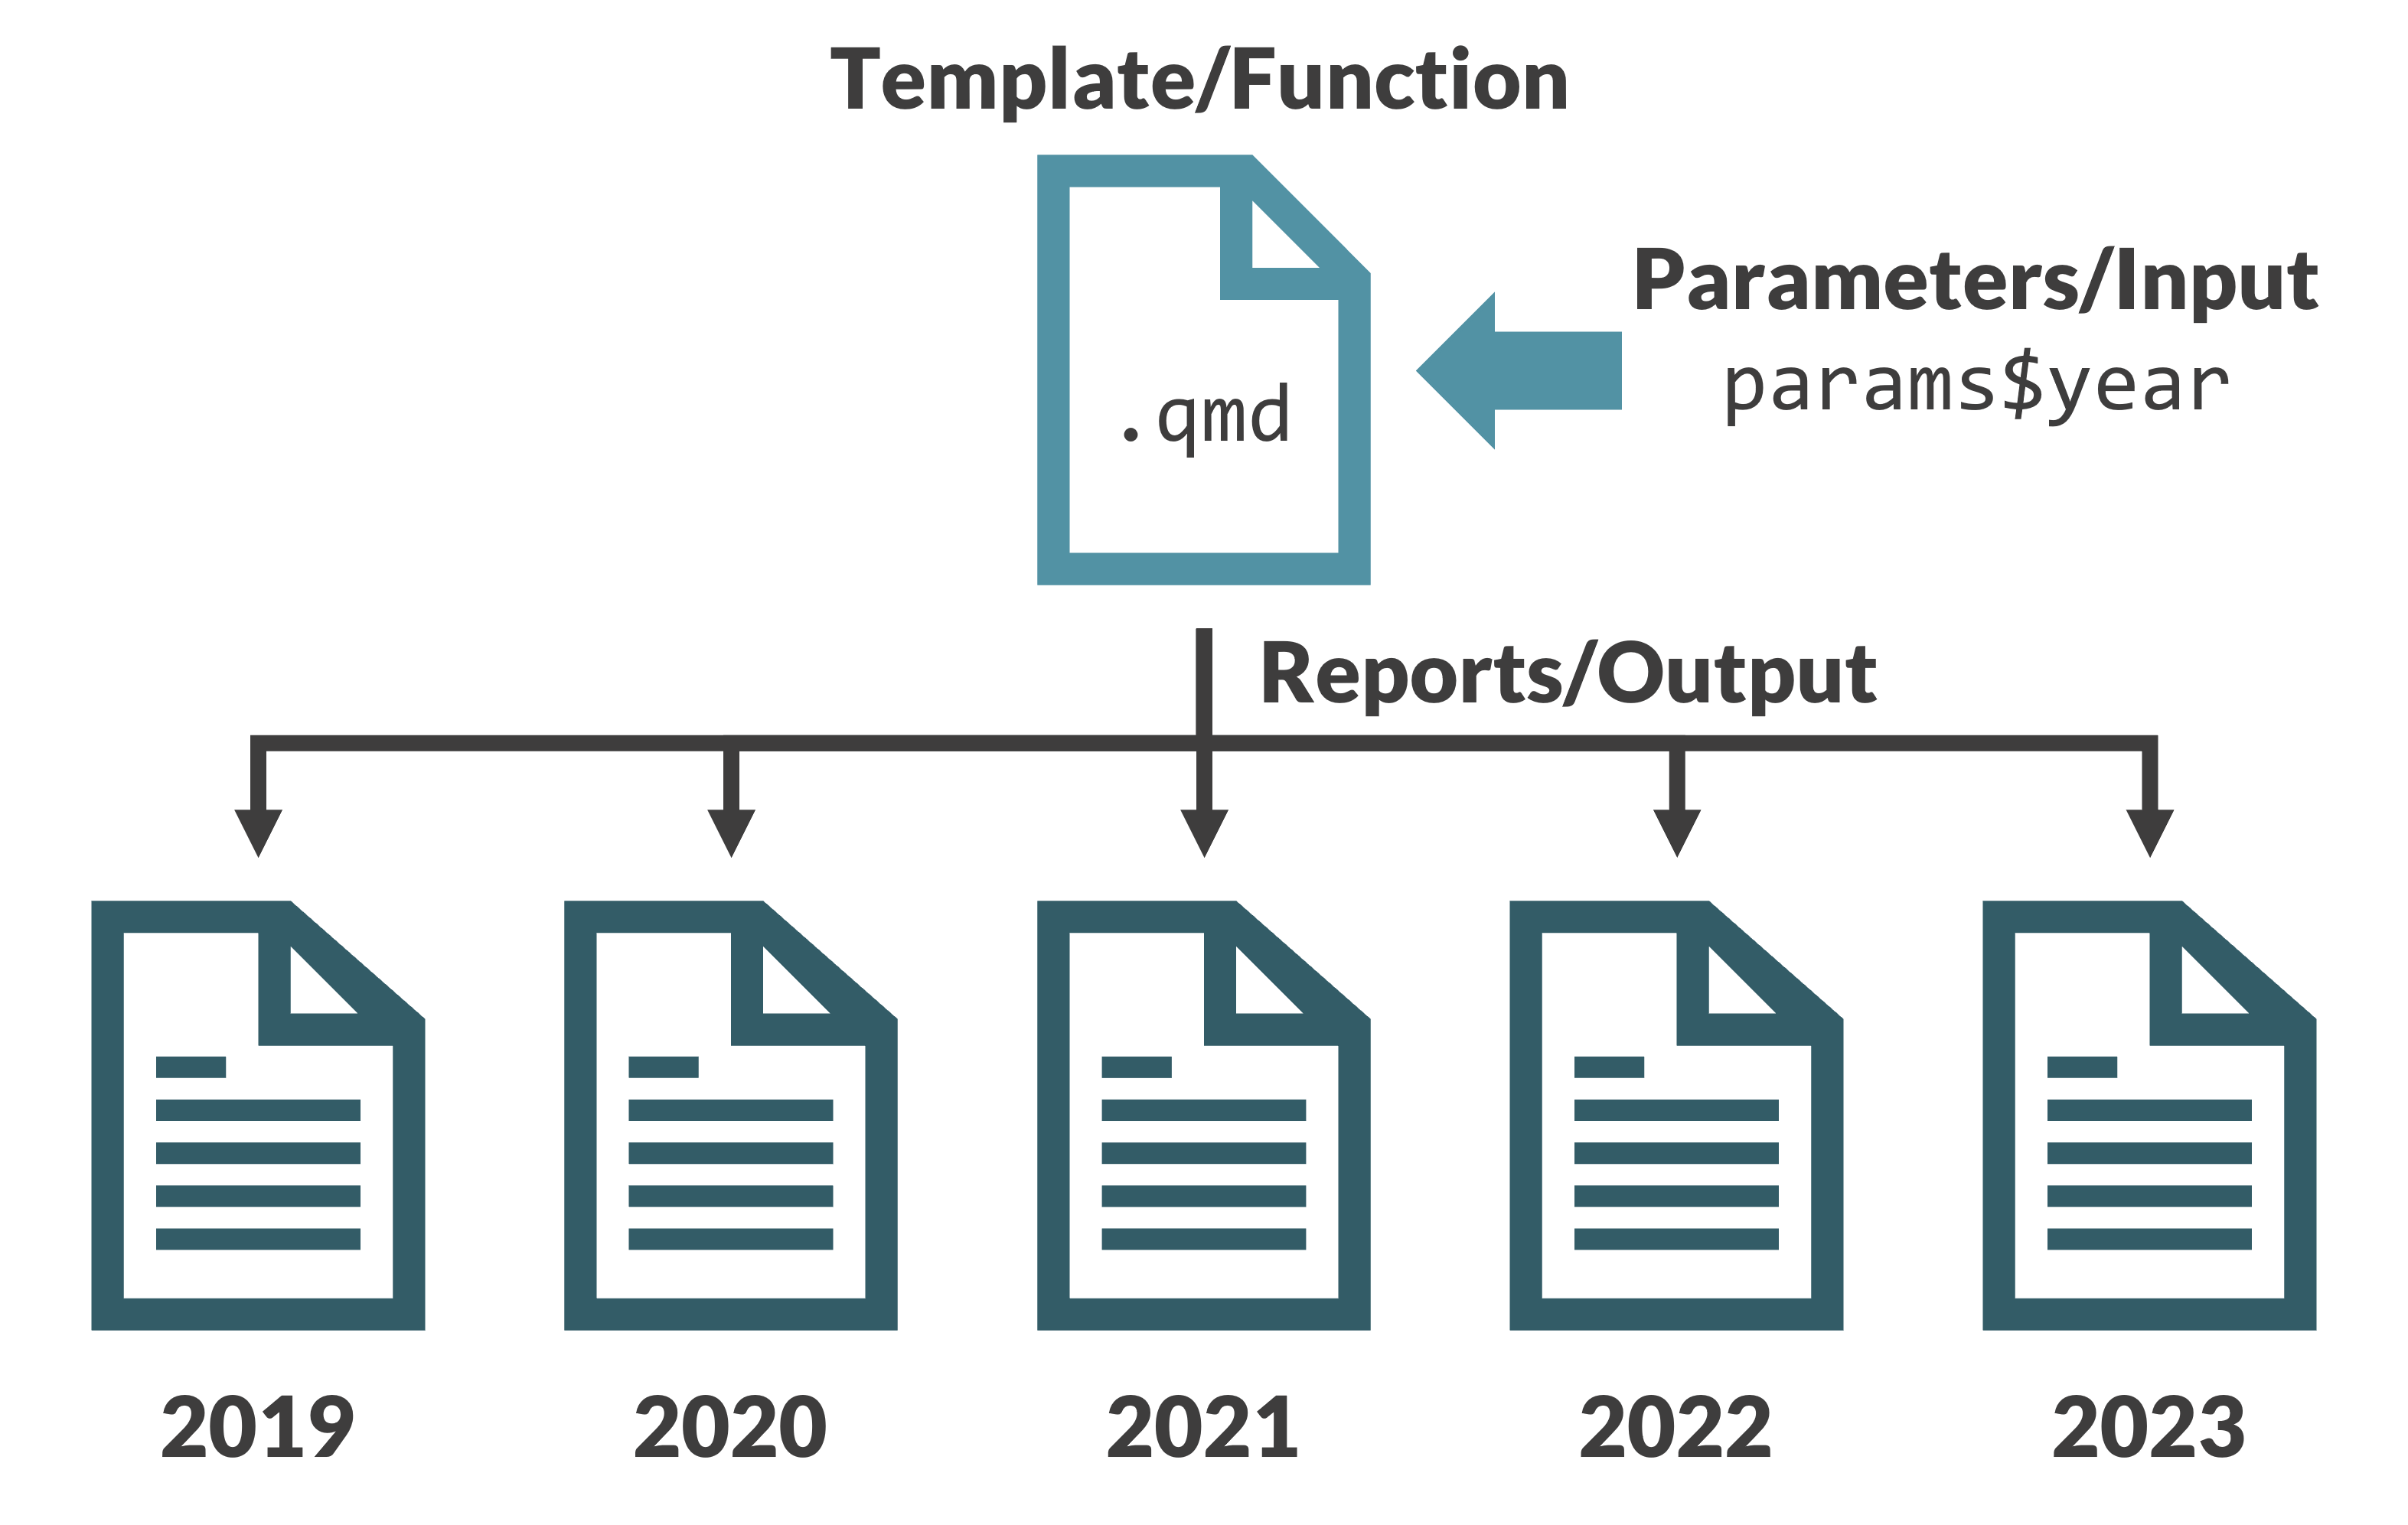
How Does Parameterized Reporting Work?


Source: Jadey Ryan
Manually Create Multiple Reports
- You can manually make multiple reports by, for example, adjusting the country you filter on in your Quarto document
Parameters
---
title: "Report on Life Expectancy"
format: html
execute:
  echo: false
  warning: false
  message: false
---Parameters
YAML
---
title: "Report on Life Expectancy"
format: html
execute:
  echo: false
  warning: false
  message: false
params:
  country: Afghanistan
---Your Turn
- Install the
usethispackage withinstall.packages("usethis") - Run this code:
- And answer yes to the questions it gives you…
- Open the project (it should happen automatically)
- Open the
report.qmdfile and save it asreport2.qmd - Change the
countryparameter in the YAML to be calledcontinentand set the default value to be “Asia” - Adjust the code that creates the
gapminder_filtereddata frame so that it filters to use thecontinentparameter
05:00
Use Parameters for Inline Code
Your Turn
- Working in your
report2.qmdfile, use inline code to create a line that says “This report is on population in [CONTINENT] from 1952 to 2007.” - Use inline code to make the [CONTINENT] portion use your parameter
- If you finish early, write code to make the 1952 and 2007 values show up using inline R code
05:00
Render with R Script
- Create a new file (
render.Ris what I typically call it) - Use the
quarto_render()function from thequartopackage:
Your Turn
- Install the
quartopackage usinginstall.packages("quarto") - Open the file called
render.Rfile and save it asrender2.R - Adjust the code to render your
report2.qmddocument using thequarto_render()function
05:00
Add Arguments to quarto_render()
- Add additional arguments to
quarto_render():
Your Turn
- Working in the
render2.Rfile, add anexecute_paramsargument to thequarto_render()function to render the report for Africa - Also change the name of the rendered HTML file to
Africa.htmlusing theoutput_fileargument
05:00
Render Multiple Reports with quarto_render()
- Create a tibble (i.e. data frame) with the data for all of the reports you want to create:
Render Multiple Reports with quarto_render()
- Use the
pwalk()function from thepurrrpackage to render all reports:
Your Turn
- Working in the
render2.Rfile, create a vector calledcontinentsthat has all continents for which we want to make reports. Use the code below as a model.
Your Turn
- Working in the
render2.Rfile, create a tibble calledreportsthat has all of the data needed to render all reports. Use the code below as a model.
Your Turn
- Working in the
render2.Rfile, use thepwalk()function from thepurrrpackage to render all reports. Use the code below as a model.
Additional Exercise
- Create a set of parameterized reports for each year that have a bar chart that shows the population in each country


